A comprehensive XRP price analysis reveals that Ripple's native token is staging a decisive counter-offensive against market bears, holding firmly above $1.308 after breaking out of a multi-week falling channel pattern. As market volatility picks up across major digital assets, XRP/USDT has decoupled from earlier downward momentum, shifting short-term market structure in favor of buyers. However, technical traders are closely watching a dense cluster of overhead moving averages that could dictate whether this breakout develops into a full-scale rally.
XRP Price Analysis: Technical Breakout Meets Heavy EMA Resistance

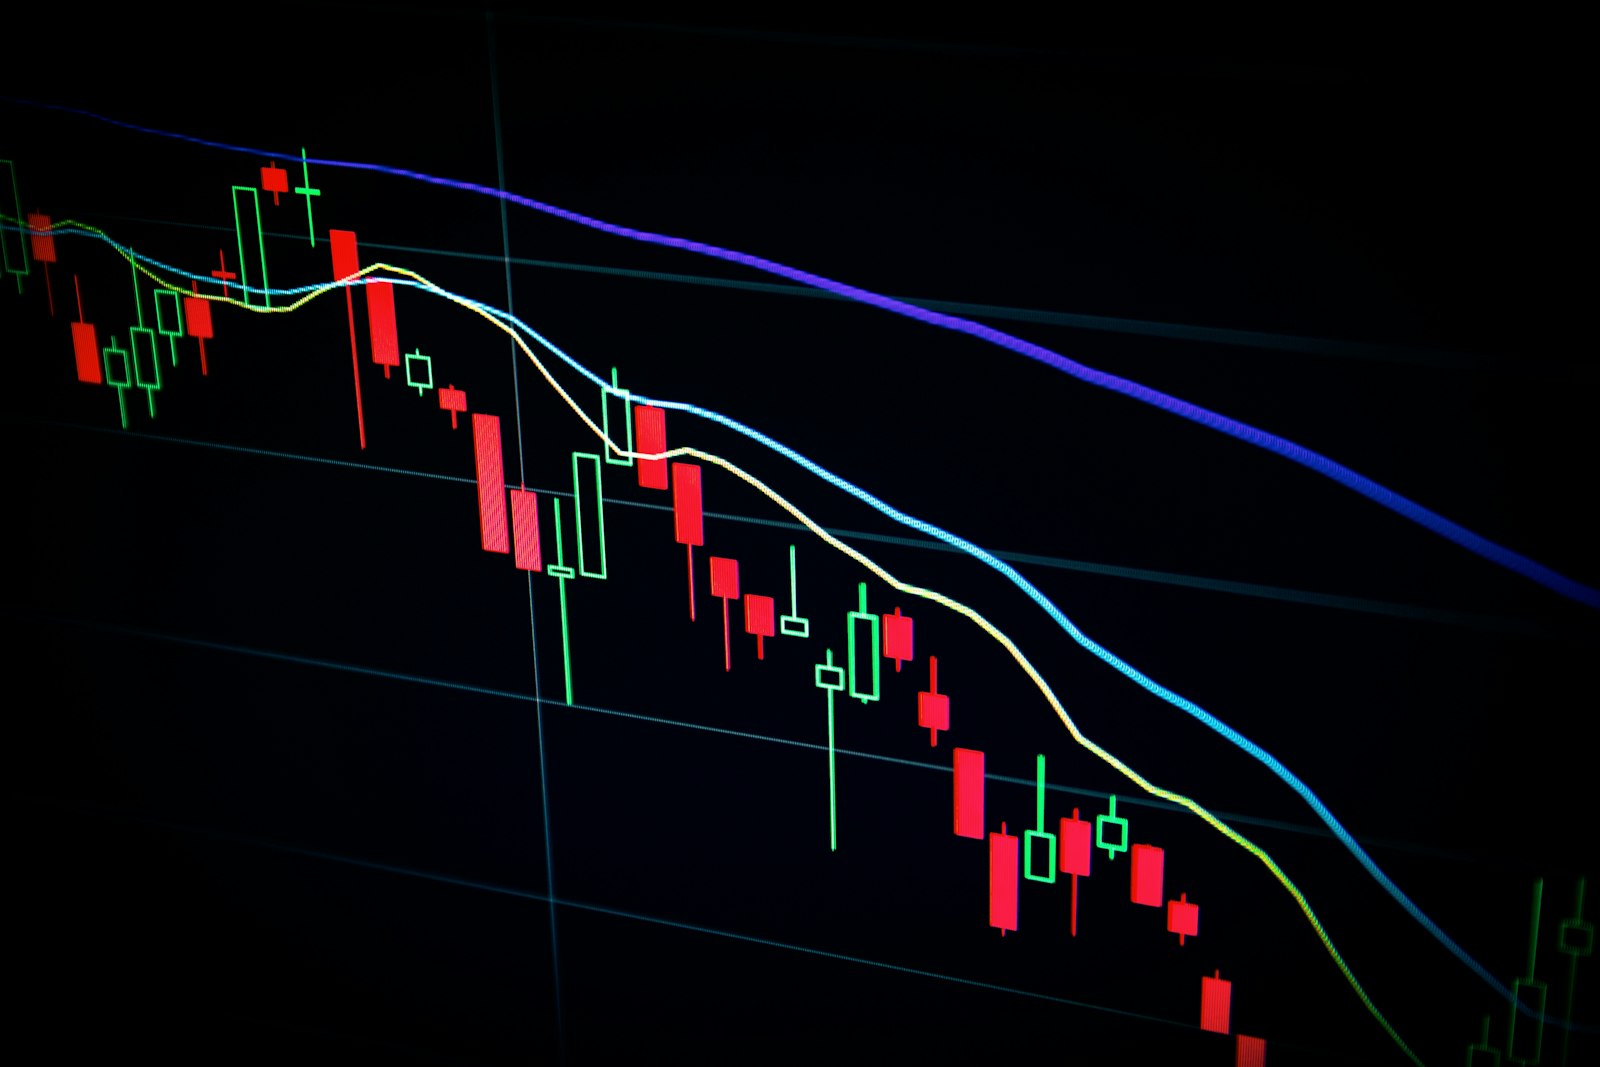
From a chart perspective, closing above the upper descending boundary of the falling channel represents the first structural victory for XRP bulls in several weeks. The token pushed from weekly lows near $1.250 to tag an intraday high of $1.316 before settling around $1.308. Despite this encouraging pattern completion, the asset must still overcome a tight cluster of Exponential Moving Averages (EMAs) overhead to confirm trend sustainability.
Technical indicators present a constructive yet delicate picture:
- Overhead EMAs: Immediate dynamic resistance stands at the 100-day EMA ($1.323), followed closely by the 50-day EMA ($1.335) and the pivotal 200-day EMA ($1.378). A decisive daily close above the 200-day EMA would mark a structural shift from relief rally to macro uptrend.
- RSI and Momentum: The daily Relative Strength Index (RSI) has curled upward from oversold territory near 37 toward neutral ground around 48, indicating that aggressive selling pressure has dissipated without pushing the asset into overbought extremes.
- MACD & Bollinger Bands: The MACD histogram is compressing toward a bullish crossover baseline, while the Bollinger Bands are beginning to widen after days of tight contraction, signaling that price expansion is underway.
In market environments where breakouts encounter multi-layered resistance, automated signal tools such as BlastSignals flag setups like this with a confidence score, allowing traders to systematically evaluate whether volume confirms the directional move.
On-Chain Signals and Macro Catalysts Driving XRP
Beyond the technical chart, on-chain metrics and broader macro developments provide valuable context for the ongoing rebound. Derivatives data highlights a gradual unwinding of crowded short positions, with perpetual funding rates stabilizing back into neutral territory. Concurrently, exchange reserves for XRP on major platforms including Binance have dropped toward multi-year lows, underscoring sustained net whale outflows into cold storage rather than immediate selling.
On the catalyst front, the aftermath of the United States midterm elections has injected fresh optimism into regulatory discussions. Market participants are anticipating renewed momentum around long-delayed digital asset structure legislation. Reassuring public remarks from Ripple leadership emphasizing the resilience of domestic market adoption have further bolstered sentiment across related large-cap tokens like Stellar (XLM).
Bull vs. Bear Scenarios: What Moves XRP Next?
How market participants interpret price action over the coming sessions will depend on two distinct technical pathways:
The Bullish Scenario: If XRP buyers generate sufficient spot volume to clear the 100-day EMA at $1.323 and push through the 200-day EMA at $1.378, technical desks anticipate an opening toward higher structural resistance levels at $1.540, with longer-term momentum targeting the psychological $1.900 zone.
The Bearish Scenario: Failure to close above the $1.323–$1.335 EMA barrier could result in a classic breakout pullback. In that scenario, XRP risks sliding back into its prior trading band, testing initial psychological support at $1.250. A loss of the major structural floor at $1.200 would completely invalidate the channel breakout and expose the market to deeper downside exploration.
Frequently Asked Questions
What are the critical resistance levels in this XRP price analysis?
The most immediate resistance levels sit at the 100-day EMA ($1.323), the 50-day EMA ($1.335), and the 200-day EMA ($1.378). Clearing this dynamic band is necessary to unlock horizontal resistance at $1.540.
What fundamental catalyst sparked the recent XRP price recovery?
The price rebound has been driven by fading seller momentum following US midterm election outcomes, on-chain whale accumulation leading to reduced liquid exchange reserves, and renewed legislative discourse surrounding clear US crypto regulations.
Where is key downside support located for XRP/USDT?
Primary immediate support lies at $1.250, followed by a critical horizontal structural base at $1.200, which serves as the primary invalidation level for the bullish breakout thesis.
Disclaimer: This article is provided for informational and educational purposes only and does not constitute financial, investment, or trading advice.
Cover photo: Jakub Żerdzicki / Unsplash