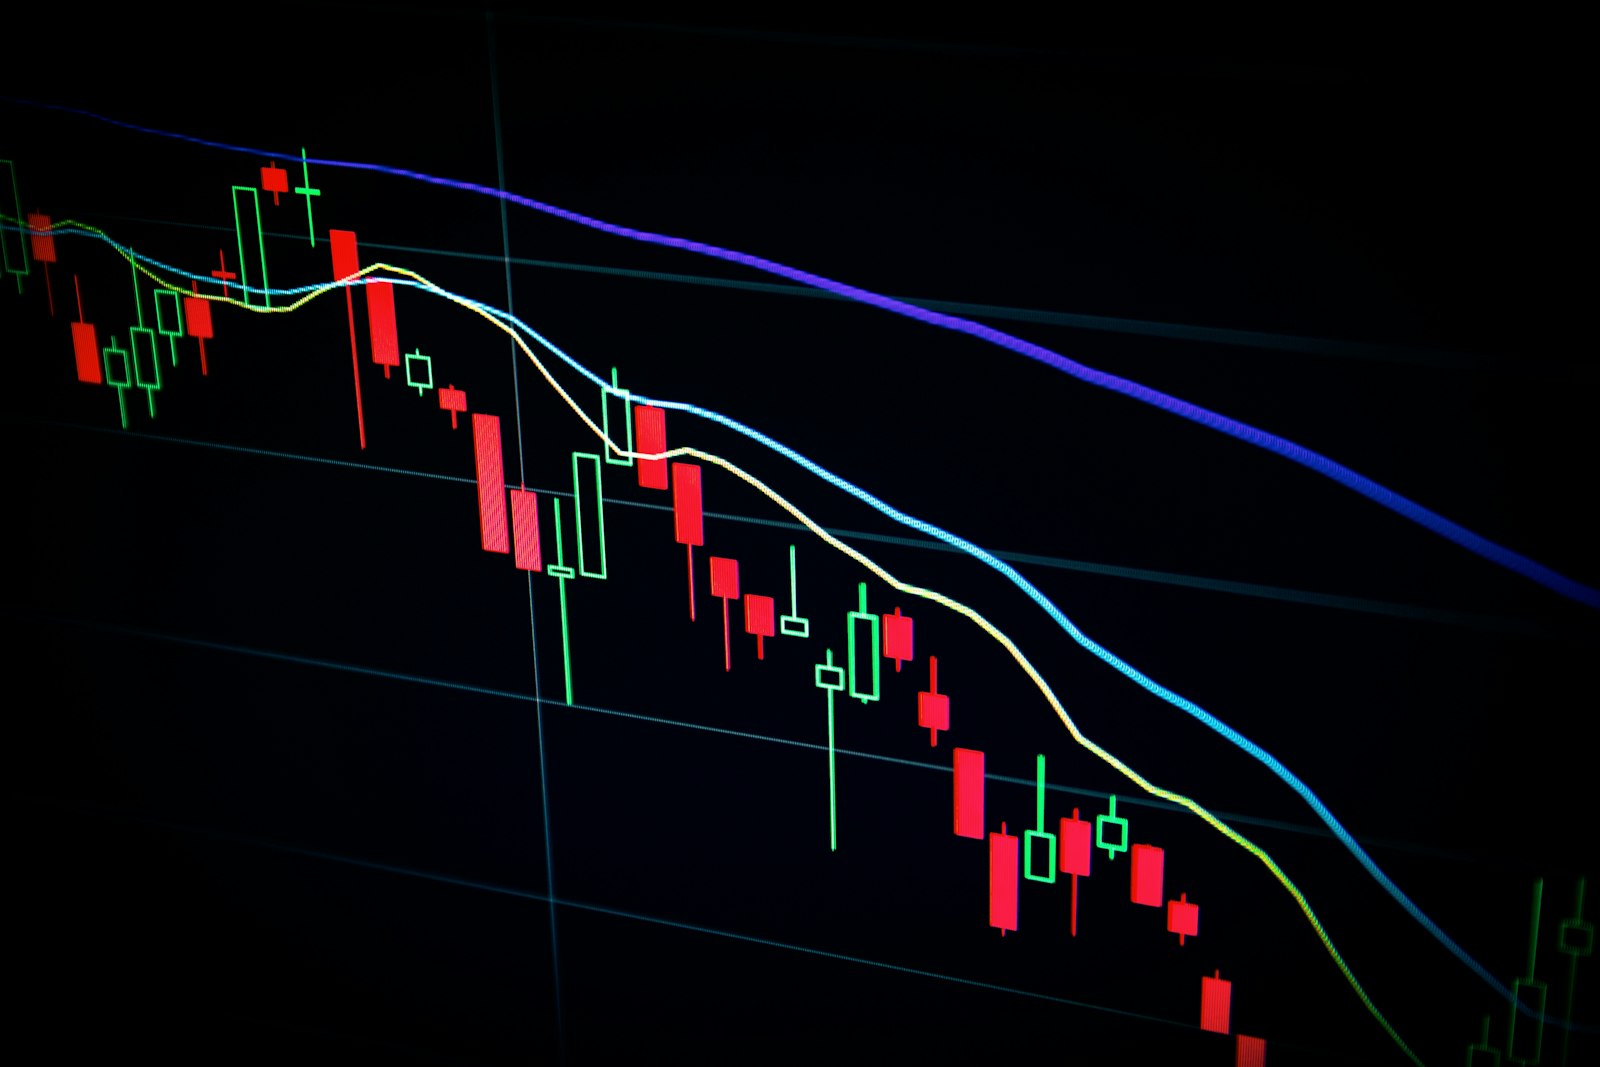
A data-driven Solana price prediction hinges on how buyers defend the critical $100 psychological threshold. Over the past 24 hours, Solana (SOL/USDT) has experienced heightened volatility, retreating roughly 2% to trade around $100.50 to $101.50. While the broader cryptocurrency market maintains a cautious stance, Solana faces a test of patience as institutional flows turn defensive and traders evaluate whether the asset is gearing up for a relief bounce or preparing to break lower into double-digit territory.
Technical Outlook: Key Support and Resistance Levels for SOL/USDT

From a chart perspective, SOL is hovering directly above a high-confluence support band between $99.50 and $100.60. This region has served as a reliable floor on multiple occasions over recent weeks. Below this psychological anchor, the secondary liquidity pool sits near $93.00 to $95.50, where historical demand has previously halted aggressive pullbacks.
On the upside, immediate resistance is established at the short-term moving average cluster around $102.80 and $103.50. A decisive breakout above this zone would open the pathway toward secondary resistance at $106.20, followed by the formidable 50-day Exponential Moving Average (EMA) capping rallies near $110.00. Until SOL can reclaim and hold above $104 on elevated spot volume, sellers maintain the upper hand on intraday timeframes.
Momentum Indicators and Catalysts: What the Data Shows
Analyzing key momentum oscillators reveals a market approaching an oversold compression. On the daily chart, the Relative Strength Index (RSI) hovers near 41, signaling that downward momentum is decelerating without yet triggering extreme capitulation. Meanwhile, the Moving Average Convergence Divergence (MACD) remains slightly negative, with histogram bars flattening out near the zero line—an indication of a potential consolidation phase.
Bollinger Bands on the 4-hour timeframe are notably contracting between $99.80 and $103.40, a technical signature that frequently precedes sharp directional expansion. Traders tracking volatility often look for confirmation across multiple timeframes, where automated signal tools such as BlastSignals flag setups like this with a confidence score based on multi-indicator algorithms.
Fundamentally, external catalysts are shaping price behavior. Solana-focused exchange-traded funds (ETFs) recorded more than $33 million in net outflows over recent sessions, reflecting transient institutional caution. In addition, on-chain trackers noted exchange deposits totaling over 170,000 SOL from newly active wallets, injecting temporary supply overhang into centralized order books.
Solana Price Prediction: Bullish Breakout vs. Bearish Breakdown Scenarios
Market participants generally view the current structure through two distinct scenarios:
The Bullish Case: If bulls successfully defend the $100 floor and push the daily close above $103.50, technical short-covering could accelerate. In this scenario, momentum would likely propel SOL toward the $106.80 level, with an extended test of the $110 resistance zone if macroeconomic conditions stabilize.
The Bearish Case: A sustained close below $99.50 on high volume would validate a bearish breakdown. Such an impulse would likely trigger cascading stop orders, exposing downside targets near the $95.00 support area and potentially the $91.50 liquidity pocket before buyers regain equilibrium.
FAQ
Will Solana stay above the $100 level?
Solana continues to test the $100 support line. While buyers have repeatedly defended this zone, sustaining it depends heavily on slowing ETF outflows and broader crypto market stability.
What are the critical resistance levels to watch for SOL?
The primary short-term resistance sits between $102.80 and $103.50. Reclaiming that range shifts the focus toward $106.20 and the major trend barrier at $110.00.
How do ETF flows impact this Solana price prediction?
Institutional redemptions create short-term selling pressure on spot exchanges. A reversal back toward positive weekly net ETF inflows would provide the capital needed to confirm a bullish reversal.
Disclaimer: This article is strictly for informational and educational purposes only and does not constitute financial, investment, or trading advice. Always conduct your own research before trading cryptocurrencies.